Watson IoT Platform
Designing the next step after connectivity
IBM Watson IoT Platform was software for connecting, monitoring, and acting on large numbers of devices and assets - the foundation that allowed organizations to turn connected data into operational insight.
My work on Watson IoT Platform was where my software journey at IBM really began, shaping experiences for a platform operating at massive scale in an emerging category.
The challenge
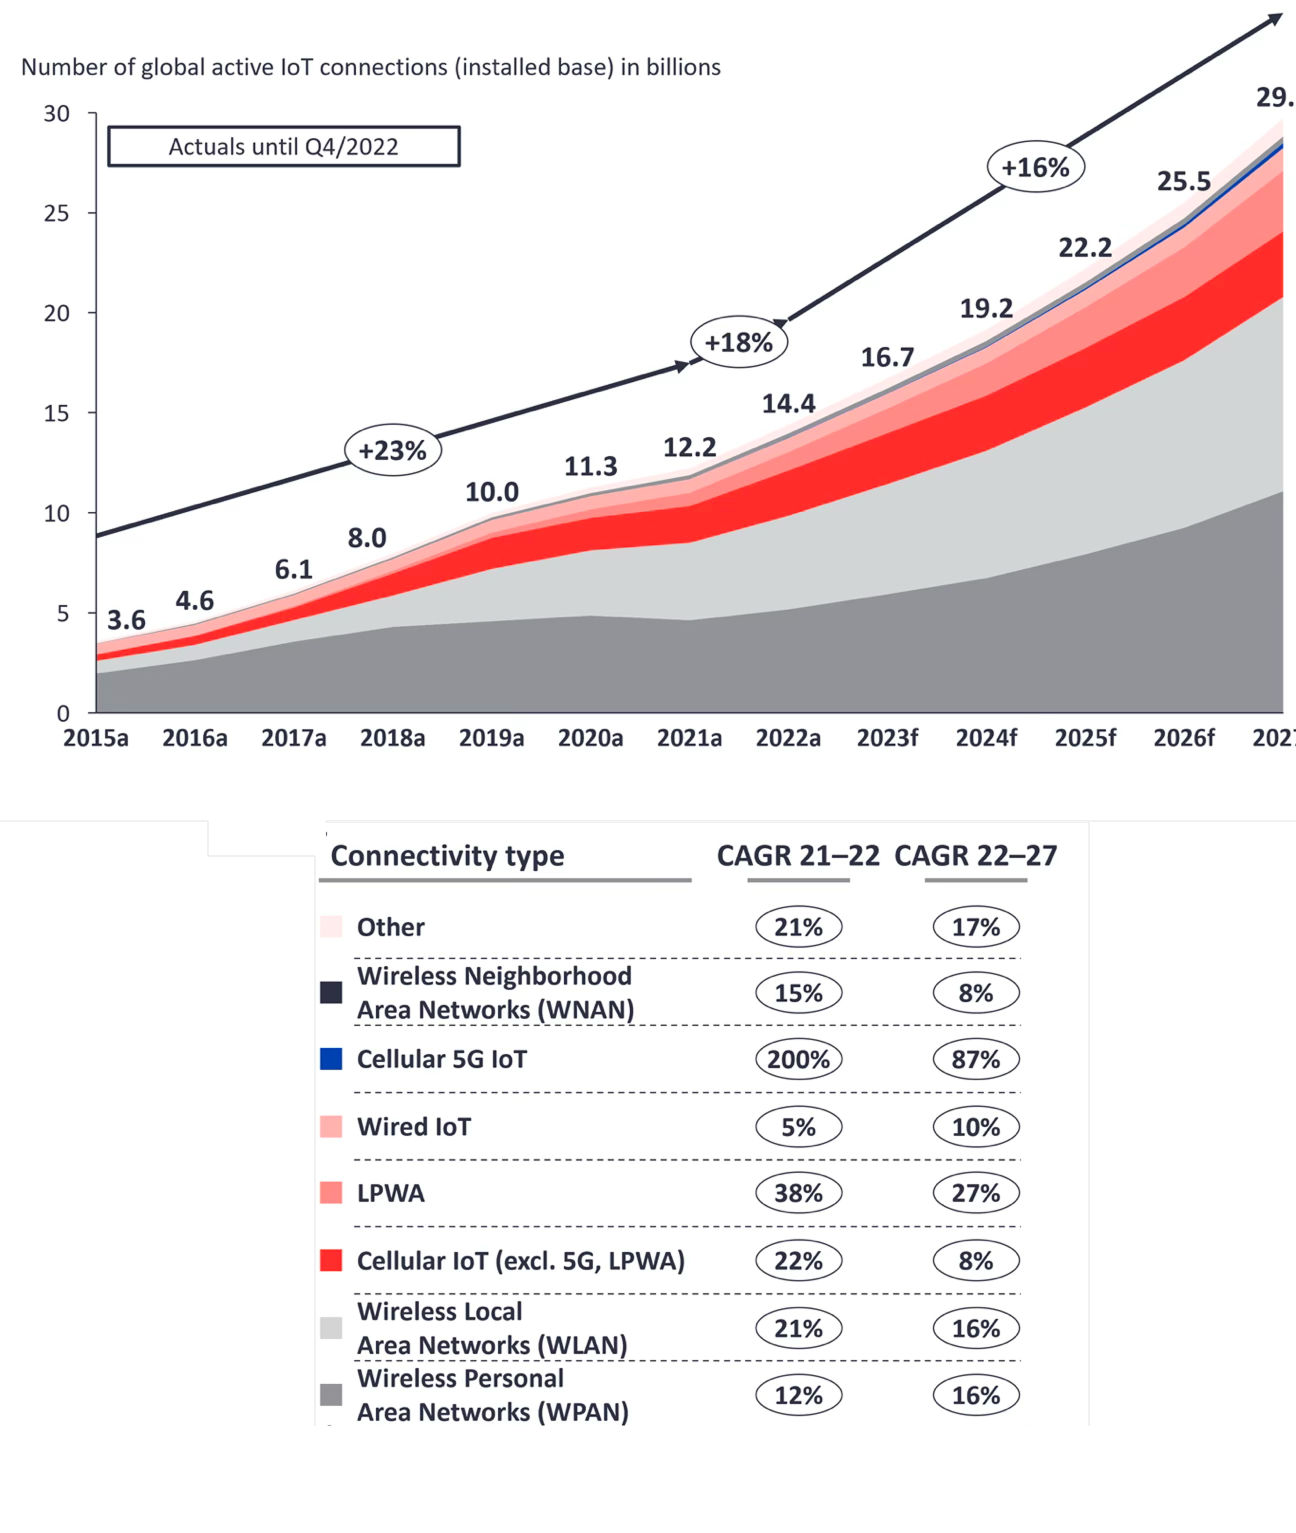
At the time, the market was full of attention on connectivity itself: getting devices online, receiving telemetry, proving the platform could connect and scale. But the real value was always going to come after that.
Once assets and devices are connected, what can users actually understand, decide, and do? That is where the product becomes meaningful.
My role
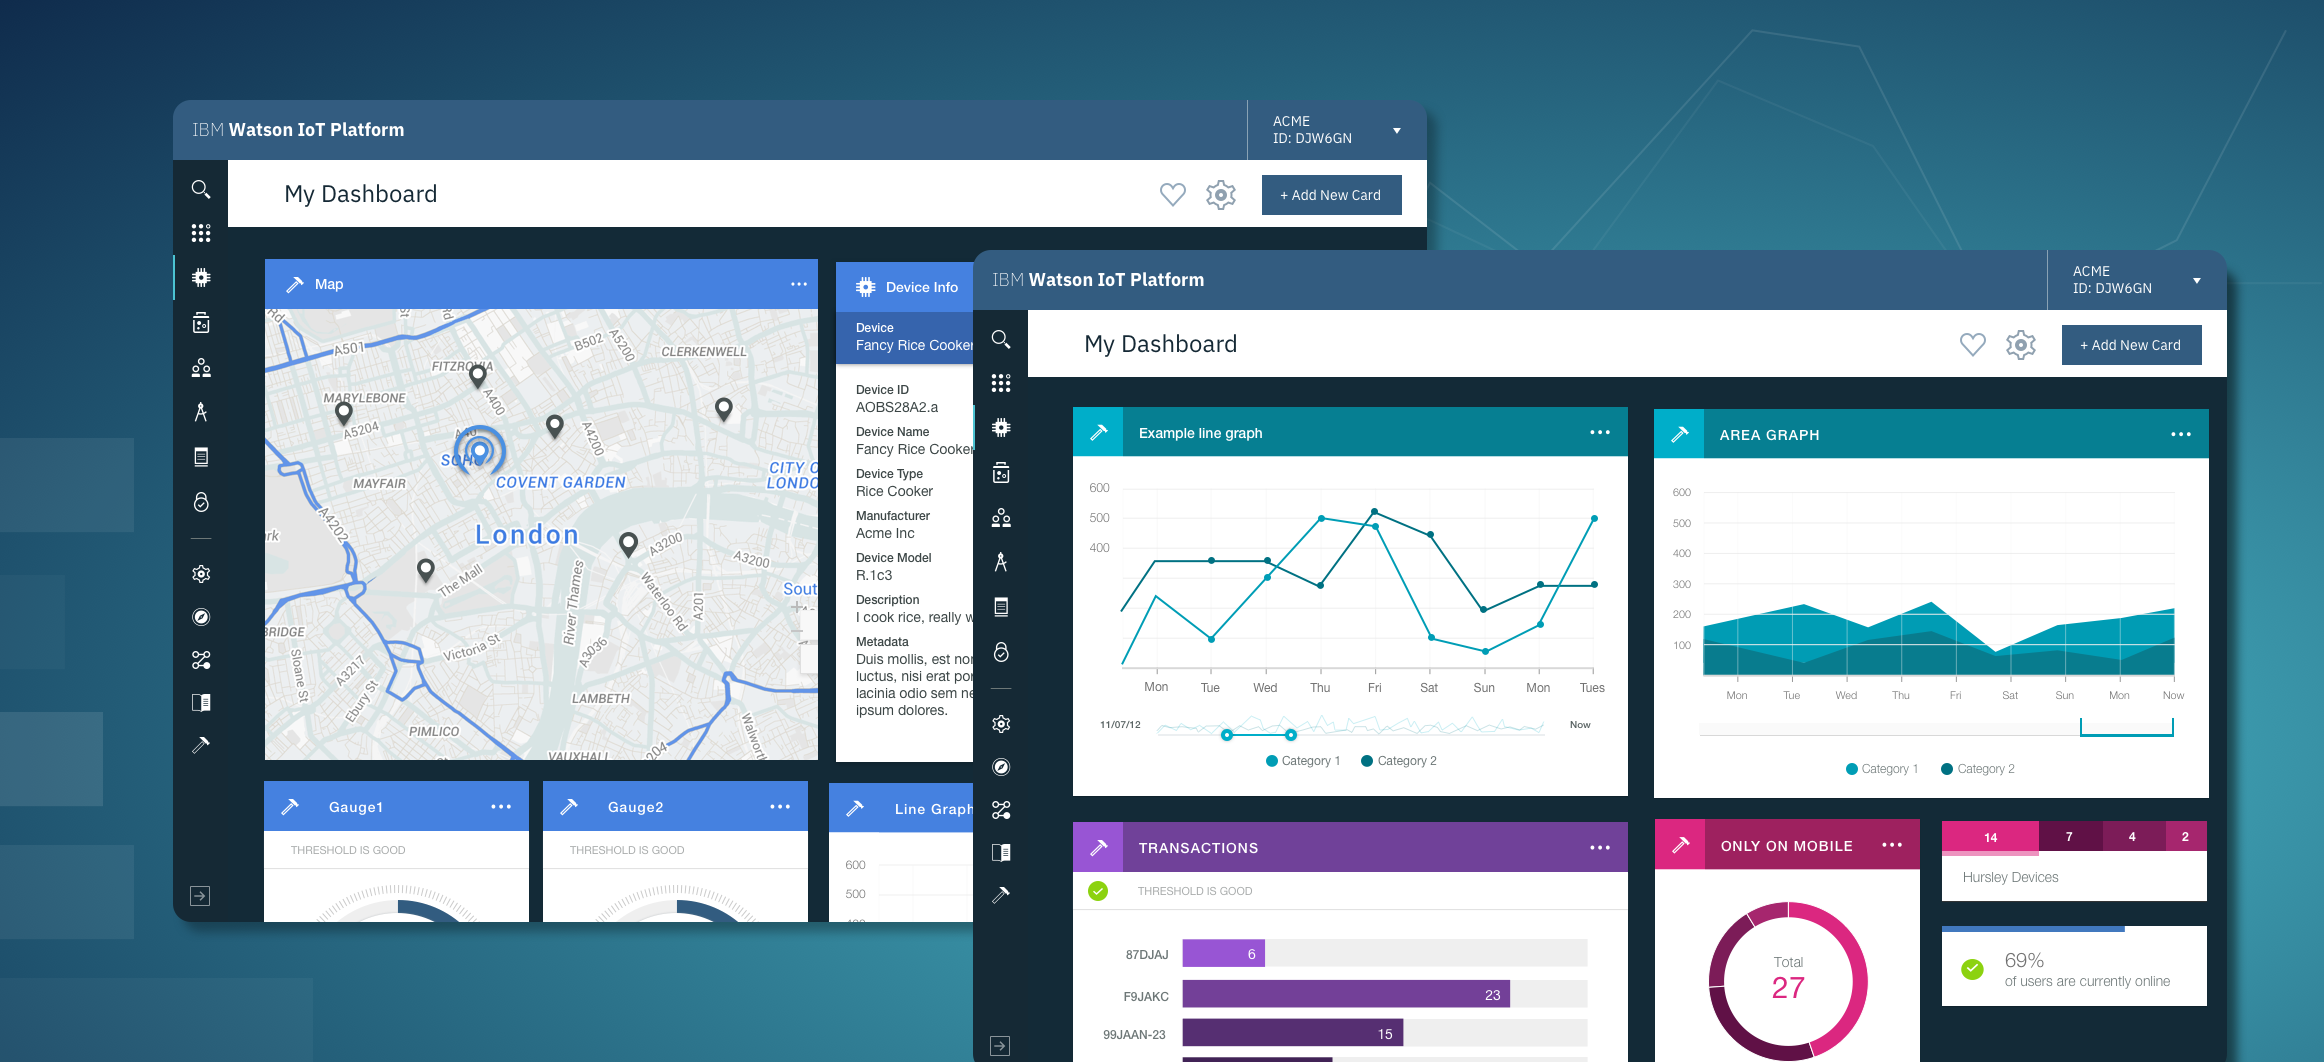
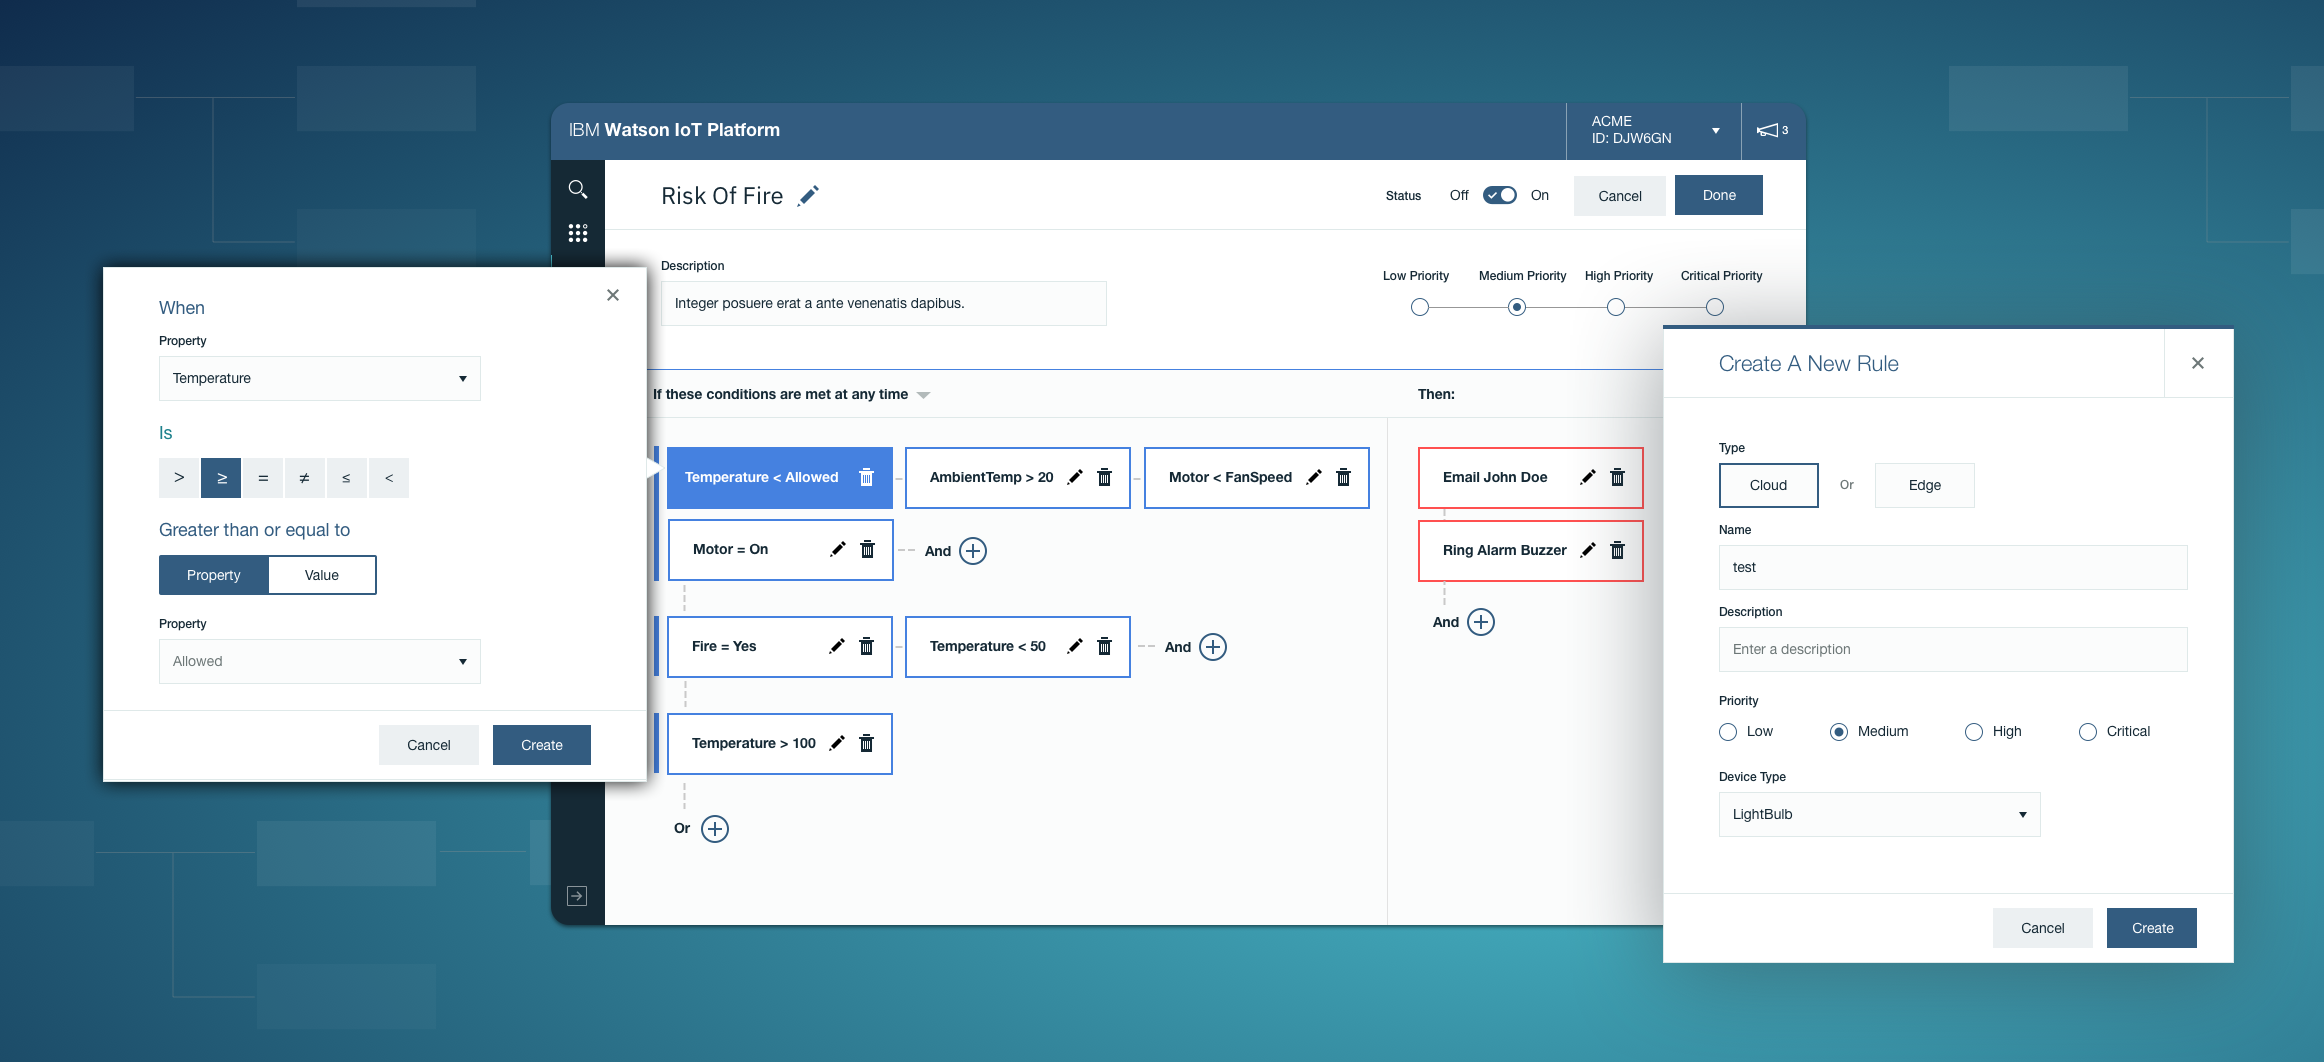
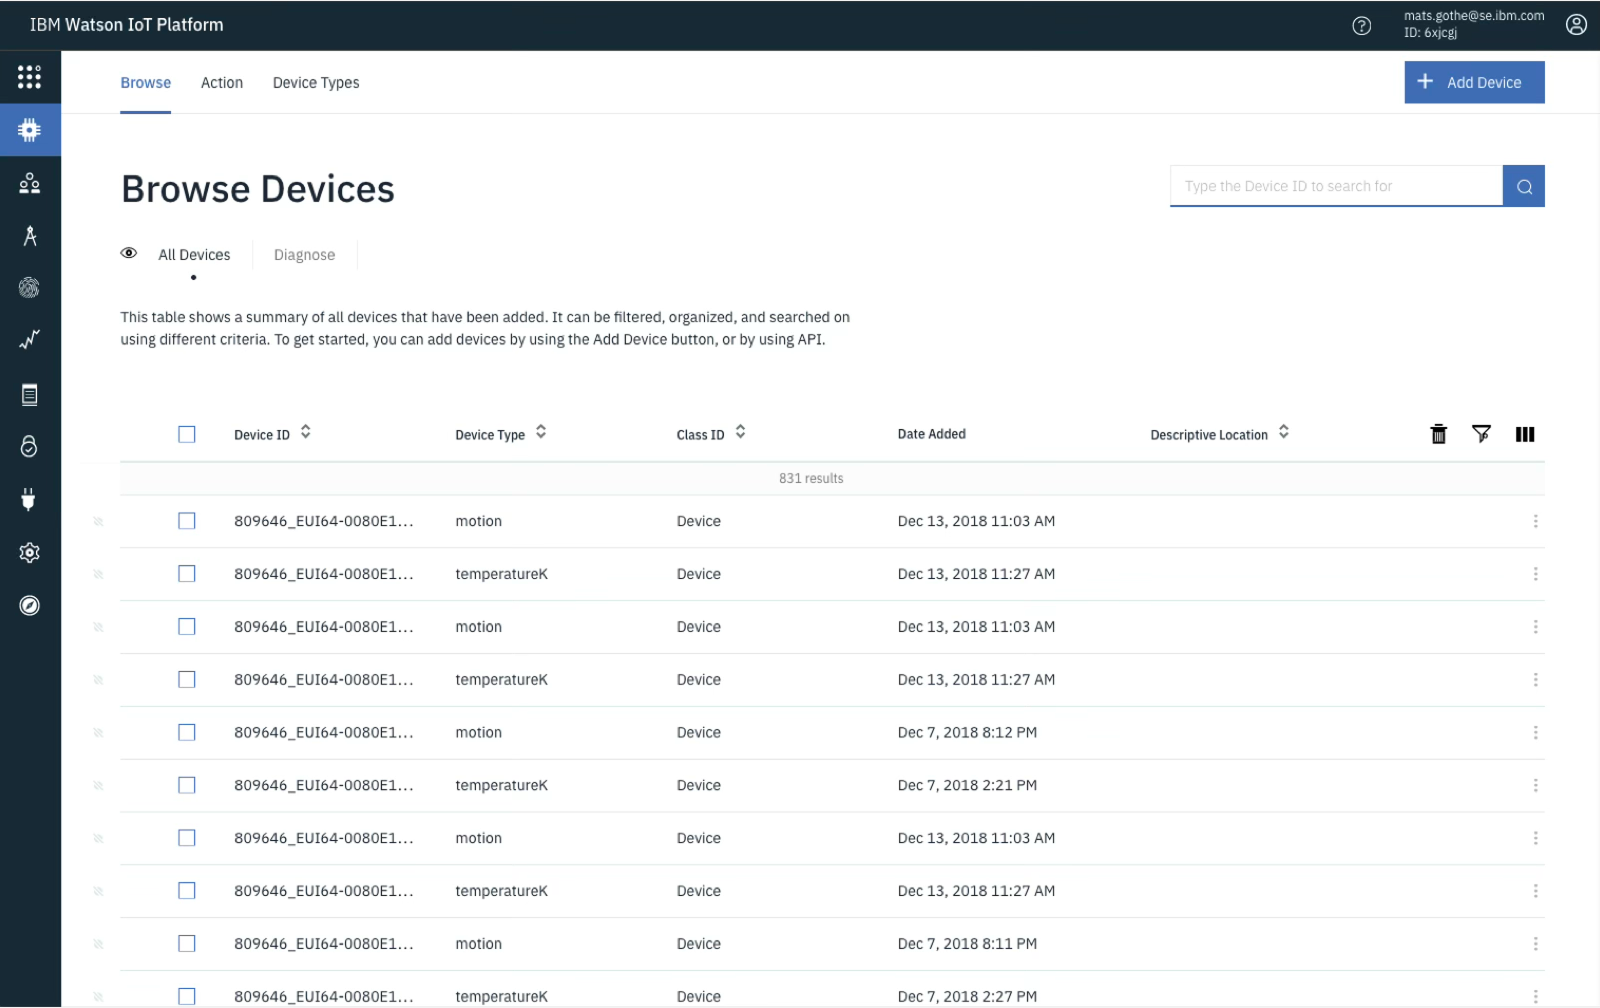
I worked on several of those next-step experiences, including information management, dashboards, real-time insights, and IBM’s first fully commercialized applied edge capability. The challenge was designing for environments where actions might need to scale across huge numbers of devices and events, while still feeling understandable and useful to the people operating them.
I also played a major role in helping the team move from a homegrown design system toward Carbon, improving consistency and giving the platform a stronger long-term foundation. That mattered not just visually, but organizationally: it reduced custom components, improved reuse, and made the product easier to evolve at speed.
What made this hard
This project taught me early that the hard part is rarely the connection itself. It’s what people are able to do once that connection exists.
Result
For me, this project was an early lesson in the difference between enabling data to exist and making it genuinely useful. Connectivity is important, but what users can do next is where the real design challenge begins.
Selected outcomes
Contributed to a platform connecting 10M+ devices
Reduced custom components by 90% through adoption of Carbon
Helped introduce UX that reduced time to value by 50%
Helped shape real-time insight and management experiences
Contributed to a platform recognized as a Gartner Magic Quadrant leader for 5 years